



Since this morning, markets have remained relatively calm ahead of the start of peace talks in Pakistan. This provides an opportunity to examine a slightly different instrument that may present trading interest during this period: the Norwegian krone (NOK).
Norway’s economy maintains one of the most direct and transparent linkages between a sovereign currency and commodity prices among developed nations, owing to the outsized role petroleum plays in its economic structure. Oil and gas revenues account for roughly 20% of GDP and nearly 40–50% of total export earnings, meaning the Norwegian krone behaves, in many respects, as an oil-correlated currency whose value is structurally linked to crude oil dynamics. When Brent crude rallies, NOK typically appreciates against major pairs, as markets price in stronger current account surpluses, higher government revenues flowing into the Government Pension Fund Global (the world’s largest sovereign wealth fund), and a more hawkish Norges Bank stance.
That said, the correlation, while historically robust, is not perfectly linear and has shown signs of structural evolution. Norway’s fiscal framework, which channels petroleum revenues into the sovereign wealth fund rather than directly into the domestic budget, acts as a buffer mechanism, partially insulating the mainland economy from commodity volatility. Furthermore, NOK is also sensitive to global risk sentiment, EUR/USD dynamics, and Norges Bank’s relative monetary policy stance—all factors that can temporarily decouple the krone from oil price movements.
TECHNICAL ANALYSIS
From 2025 onward, USD/NOK has been steadily declining (indicating a strengthening Norwegian krone). One might argue—referring back to the earlier discussion—that oil prices last year were relatively subdued. This reinforces why we refer to correlation alongside other influencing factors, rather than definitively classifying NOK as a “petrocurrency,” as is sometimes done. In this case, USD weakness has been the primary driver, rather than NOK strength.
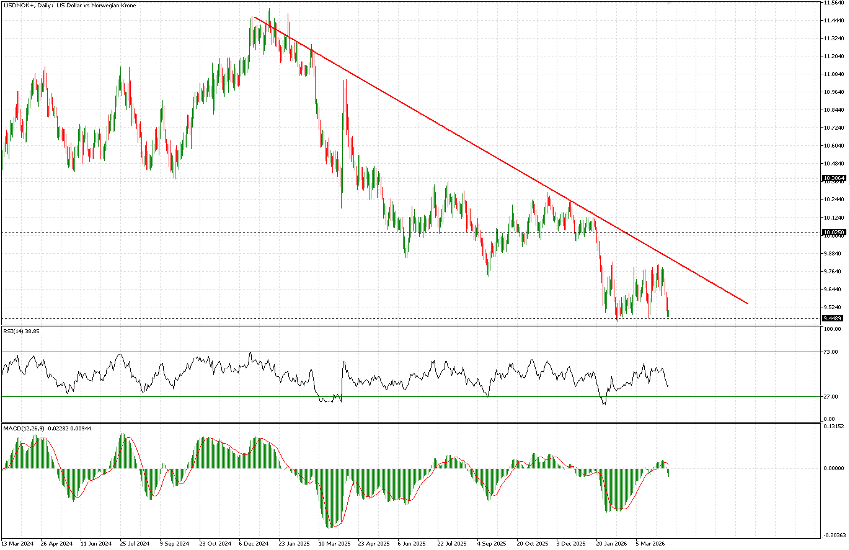
It is also notable that price is currently at an extreme—unlike what is observed in USD pairs against EUR or GBP, for example—and a new decisive downward leg began in mid-January this year (approximately one month before the spike in Brent prices), following a break below the 10.00 support level.
In recent weeks, the 9.45 level has been tested several times (potentially forming a triple bottom). This is a key level which, if broken, would expose the next long-term support at 9.20 (levels not visible on the chart as they relate to price action around 2020).
There is a slight divergence on RSI and MACD. However, the most relevant observation remains the potential triple bottom structure, which may offer a defined entry framework with controlled risk parameters, regardless of directional bias. On the upside, 9.80 remains the key level to monitor, where the downward trend line is also expected to intersect in the near term.


