


On days when news flow moves the market in an abrupt and sudden way—and when it’s not unusual to see gold down -4.03% while UK Brent oil rises +7.80% (as happened this morning), following market reactions to a speech, a statement, or a newswire release—today we want to briefly show what we mean when we talk about correlations.
You often hear us say (though never often enough) that the market is an interconnected system, where the movement of one asset corresponds to the movement—either in the same direction or the opposite—of another. Following multiple markets can therefore help you understand the bigger picture as a single, unified whole.
On one hand, a discrepancy between the expected reaction of one asset relative to another can serve as a warning signal of potential changes ahead. On the other hand, one asset may present clearer trading levels or signals than another, helping to make sense even of the more confusing chart between the two.
Two key relationships have recently been highlighted:
- Oil is directly correlated with long-term US interest rates, as rising oil prices drive higher inflation expectations and therefore higher rates.
- Gold is inversely correlated with real interest rates. This relationship had weakened in recent years (roughly since 2022), likely due to an unusually strong role played by central banks, but it has recently strengthened again played by central banks, but it has recently strengthened again.
In the charts below, we show visually what this means by plotting the 21-day rolling correlation between these asset classes. To be fair, this time window is somewhat short and noisy, and these calculations should ideally be performed on returns rather than prices, but for simplicity and visual clarity we chose these parameters.
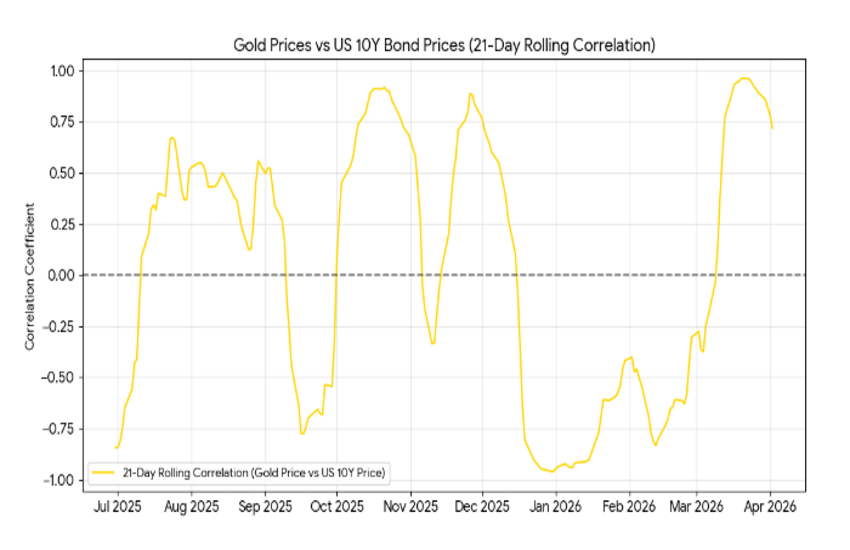
In the first chart, you can see the correlation between gold and the US 10-year Treasury price. As you can observe, this year it has risen sharply and is now very close to 75% (71.8%), indicating a strong similarity in direction between the two instruments (note that price moves inversely to yield).
In the second chart, you see the correlation between UK Brent and—again—the 10-year Treasury, which in this case stands at -60.5%.
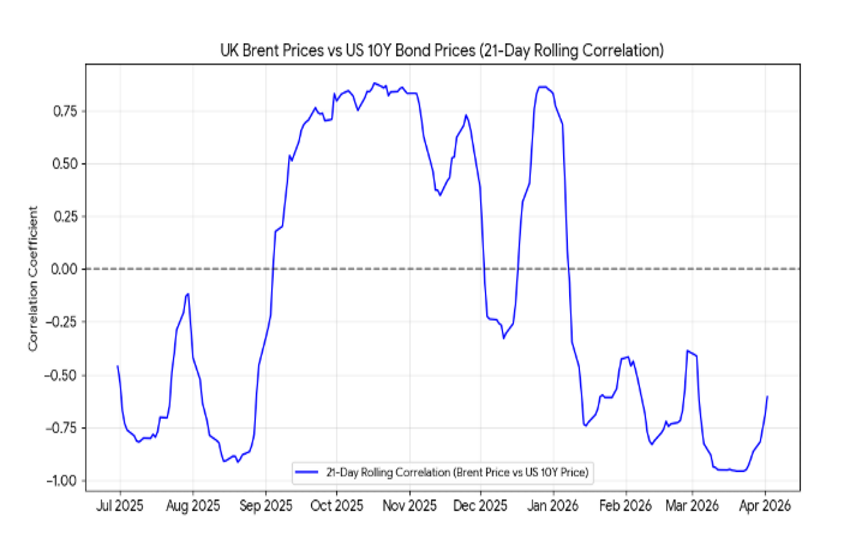
In both cases, these are elevated values and highlight the importance of monitoring all three instruments simultaneously, especially in periods like the current one.


