



Last week saw a sharp decline of 22.23% in Natural Gas futures (NGAS), with prices falling to $4.113 per MMBtu (million British thermal units). What drove such a pronounced move?
First, a preliminary clarification is warranted. Commodities exhibit materially higher volatility than equities or FX. This is readily observable in instruments such as crude oil and silver, and even more so in soft and agricultural commodities. To put this into quantitative terms, implied volatility indices exist for many tradable assets, not only the S&P 500. While the VIX closed last week at 16.62, the equivalent measure for EUR/USD stood at 5.95, whereas NGAS CVOL closed at an exceptionally elevated 78.24.
Turning back to the price dynamics of Natural Gas, it is essential to recognize that NGAS is an extremely seasonal commodity—arguably the most seasonal of all. In broad terms, there is a period between April and mid-October / late November during which winter demand has passed and inventories are gradually rebuilt for the following year (the “injection season”). This is followed by the “withdrawal season,” typically from late autumn through March, when accumulated inventories are drawn down and consumed.
It is therefore not unusual for gas prices to rise during the injection season and to form a peak in early winter—or, in cases where inventories are perceived as tight and winter temperatures are colder than expected, somewhat later, around February.
Once inventories begin to be drawn down—as is the case now—prices become particularly sensitive to changes in weather expectations. This is precisely what occurred last week. Weather models shifted toward forecasting a milder-than-average end of December, especially in the United States, and producers likely took advantage of this shift to lock in profits from the prior rally by aggressively selling futures and forward contracts. One clear signal of this market expectation is the very narrow spread between March and April futures ($0.032/MMBtu), suggesting that the market is not pricing in a particularly harsh winter and expects inventories to remain sufficient through March, allowing for a smooth rollover into the next injection season—at least for the time being.
TECHNICAL ANALYSIS
As illustrated in the chart, NGAS began its upward move this year on August 25 from approximately $2.65, accelerating decisively from October 20 onward and reaching a peak above last season’s high at around $5.20. By comparison, last year’s cycle saw a peak in late December, followed by a pullback into late January, which then paved the way for a final leg higher.
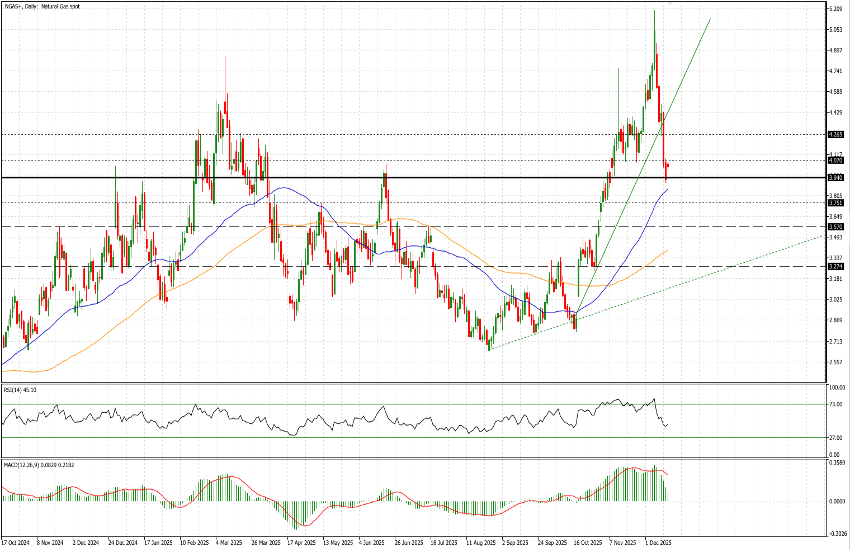
From a technical perspective, last week’s sell-off brought prices down to the $3.94 area, which marked a high in December 2024 and subsequently served as a base for the late-winter rally before prices declined toward $2.90 in April. This level is therefore technically significant, and the 50-day moving average is also approaching this area, providing additional support.
The steepest ascending trendline was decisively broken last Thursday. Should prices attempt to retest it, two key resistance levels stand out at $4.07 (touched overnight) and $4.26. Following such an abrupt move, we continue to expect elevated volatility. On the downside, relevant support levels to monitor are $3.75 and $3.57.
Finally, we emphasize the exceptionally high volatility of this instrument—during the time required to draft this note, prices declined by $0.06, or approximately 1.5%. As such, Natural Gas futures are primarily suitable for experienced market participants who are well equipped to manage significant price fluctuations.


