Unlike other indices — including the American S&P 500, the Italian FTSE MIB, and the Spanish IBEX 35 — which have now, quickly and somewhat surprisingly, returned to within touching distance of their recent or all-time highs, the German DAX has lagged behind in its recovery. In this sense, it more closely resembles the Dow Jones Industrial Average, perhaps due to its nature as an index composed of major industrial groups and the so-called value sector.
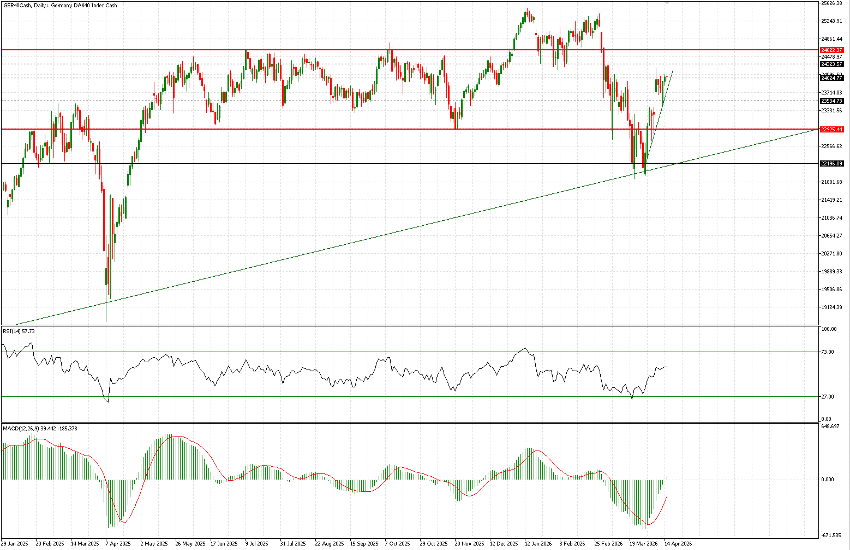
At the moment, it is trading at 24,058, while its all-time high of 25,518 remains roughly 6% away. That said, it has recovered the range in which it traded for 10 months, between 23,000 and 24,600, a range it had briefly lost during the February/March correction. The rebound in this case began around 21,900, where the very long-term trendline passes — originating in October 2022 and tested again in October 2023, August 2024, and once more in April 2025. For simplicity, you cannot see the full trendline in the chart below, but this is an excellent example of why it is always advisable to zoom out when doing technical analysis and start from higher time frames and longer periods to gain a broader perspective.
That said, what should we expect in the coming sessions? Much will still depend on the general risk sentiment, which at the moment is being driven by hopes (and perhaps by the lack of missile attacks on either side) that further negotiations between United States and Iran will succeed. Of course, relying on hope is generally risky.
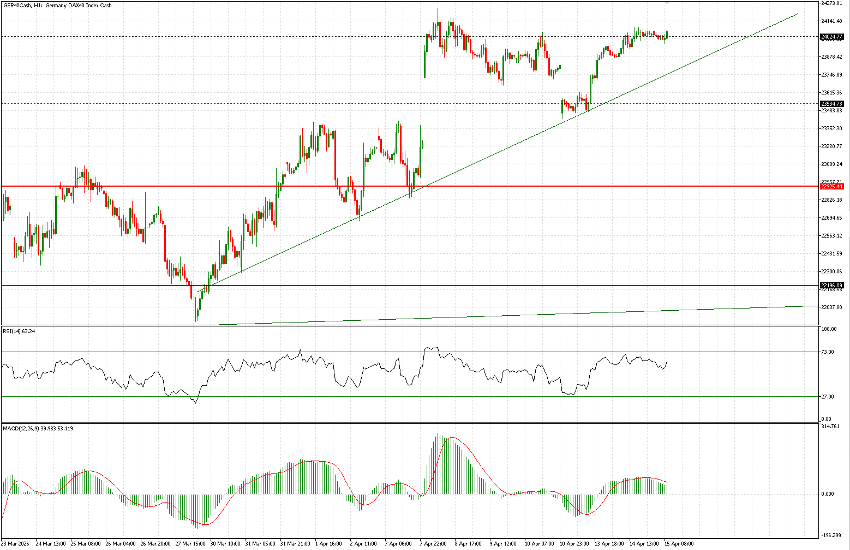
In any case, 24,000 is a minor support level, and the price is currently slightly above it. The next resistance — also minor — is around 24,300. The real obstacle, if reached, will be around 24,625. On the downside, it is worth keeping an eye on 23,550, but also 23,750.
As shown in the 1h chart, the short-term trend is clearly upward, and until a break occurs, we should assume continuation of that trend. At present, the trendline passes right through 23,750, which we therefore consider the pivotal level for today’s session.