Advertencia de riesgo: Los productos apalancados conllevan un alto nivel de riesgo y pueden resultar en la pérdida de todo su capital. Asegúrese de comprender completamente los riesgos antes de invertir.


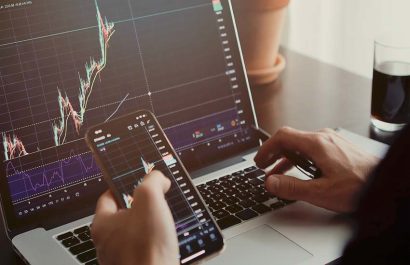
Business man trader investor analyst using mobile phone app analytics for cryptocurrency financial market analysis, trading data index chart graph on smartphone and laptop screen. Over shoulder view

Key Indicators for Market Analysis

Knowing how to use tools such as indicators is fundamental for trading in the financial markets. They provide the ability

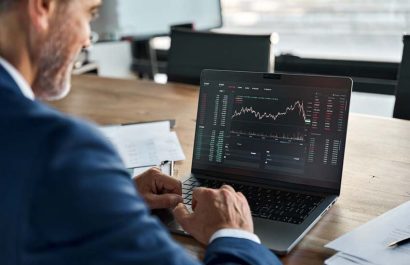
Businessman working on laptop with MARKET POSITIONING inscription, new business concept

Trading with Market Trends

Understanding trading trends is crucial for making informed decisions about buying or selling assets. Whether prices are rising, falling, or

stocktrader analyzing profit opportunity investing bitcoin. trader analyzing stock trading graph phone app. investment stockbroker profit analysis. Trade graph chart.

Understanding the Euro Stoxx 50

The EURO STOXX 50, often referred to as the Dow Jones EURO STOXX 50, is a prominent stock market index

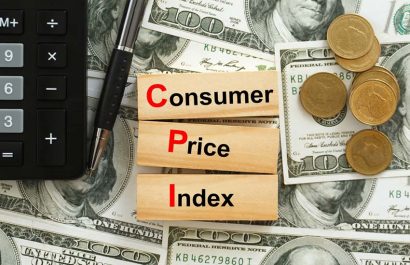
CPI, consumer price index symbol. Wooden blocks with words CPI, consumer price index on dollar bills with a calculator, coins.  Business and CPI, Business and consumer price index concept.

Consumer Price Index: A Market Guide

The CPI, also known as the Consumer Price Index, is one of the most critical economic indicators in the market.

Day Trade And Swing Trade Profits With An Up Trend Candle Stick Graph concept

The U.S. Dollar Index Explained

In this article, we take a comprehensive look at the U.S. Dollar Index (DXY), a pivotal indicator for tracking the

Stock market Investor analyst broker analyzing financial trade crypto stockmarket exchange platform digital chart data on computer screen thinking of investing analytic risk. Over shoulder view.

Fundamental Analysis for Traders

Fundamental analysis, a cornerstone of trading strategies, extends beyond its traditional association with stock markets. It’s a powerful tool for

Business team investment trading do this deal on a stock exchange developing new approaches.

Technical Analysis in Practice

Technical analysis is a method used to interpret the behavior of an asset’s price by analyzing charts, which visually represent

Two business woman investment consultant analyzing company annual financial report balance sheet statement working with documents graphs. Concept picture of economy, market, office,money and tax.

Trading Commodities and More

If you’re looking to expand into new financial markets, commodities trading might be an option worth exploring. Many traders are

Rear view of sitting businessman who is looking at the city from the modern panoramic office. New York evening view. Crossed hands on the head. Financial charts are drawn over the panoramic windows.

Paper Trading for Beginners

Paper trading is a technique that allows you to practice trading without risking real money. Essentially, it involves simulating buying

Business chart and earth on screen interface with index. Trade and finance concept. Double exposure. 3D Rendering

Precious Metals Portfolio Diversification

Today, trading has become a way not only to increase personal capital but also to open new opportunities for private