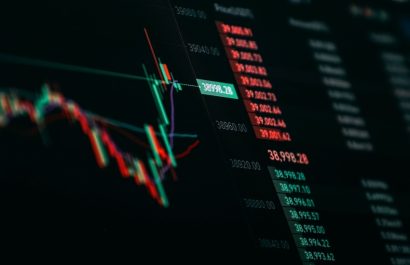



Bears and bulls are terms commonly used in the stock market to describe investors who have a positive or negative perspective toward the market.
These terms refer to the way investors look at the market. Correctly identifying trends within these categories can determine the success or failure of trades. Hence, it is important to correctly identify the “bulls” or “bears” of the market when making trades.
What are Bulls and Bears in Trading?
In the trading environment, the terms “bull” and “bear” are used to describe the market’s direction. The market is said to be bullish when prices are rising and bearish when prices are falling.
The Origin of Bulls and Bears in Financial Markets
The most common explanation for the origin of these terms refers to the movements animals make when fighting. The term “bull” comes from the way a bull attacks, raising its horns upward and pushing forward with its head, similar to the upward movement of a bull market.
Conversely, the term “bear” comes from the way a bear attacks, lowering its head and striking downward with its claws, similar to the downward movement of a bear market.
However, there is no single explanation for the origin of these terms, and other theories also exist. What is certain is that these terms are widely used in the trading world to describe market psychology and investor sentiment.
Why Bull and Bear Markets Matter to Traders
Understanding “bulls” and “bears” is vital to stock trading because these terms represent the two opposing forces that drive the financial market.
By understanding the dynamics of the movements, traders can use this information to make knowledgeable investment decisions. If the bulls are in control of the market, they may want to buy or hold their existing positions in anticipation of a steady rise in prices. On the other hand, if the bears are in control, traders may decide to sell or take short positions to profit from a decline in prices.
Additionally, it is important to keep in mind that market movements are not always driven by the forces of the bulls and bears. Sometimes, other factors affect asset prices. Nevertheless, understanding market sentiment continues to be a very valuable tool for both trading and investing.
The Balance Between Bullish and Bearish Market Forces
A “bull market” means a market in which the prices of financial assets are rising, which is usually related to an increase in investor confidence and optimism.
On the other hand, the “bear market” refers to a market in which the prices of financial assets are falling, which is normally related to an increase in investor pessimism and uncertainty.
Bull vs Bear Markets: Key Differences Explained
In financial industry parlance, a bull market refers to a prolonged period of rising financial asset prices, while a bear market refers to a prolonged period of declining financial asset prices.
The difference between a bull market and a bear market is essentially the direction of movement of financial asset prices over an extended period, which can have a considerable effect on asset and investment returns.
How to identify a bull or bear market?
To determine whether a market is bullish or bearish, traders can use technical analysis along with quantitative tools. Below are some commonly used quantitative technical indicators to identify trends and determine market conditions:
Time Series Analysis
Time series analysis is a statistical technique utilized for identifying patterns in data. To know whether a market is bullish or bearish, traders can use time series analysis to analyze the historical prices of an asset and look for patterns of behavior.
Relative Strength Indicator (RSI)
The RSI is another well-known technical indicator used for trend measurement in a market. The RSI compares the magnitude of recent gains and losses to determine if the market is overbought or oversold.
If the RSI is above 70, the market is considered overbought and may be an indication of an impending bear market. On the other hand, if the RSI is below 30, the market is oversold and may be a sign of an impending bull market.
Using MACD to Identify Trends
The MACD is another well-known technical indicator used to identify trends in the market. The MACD is estimated by subtracting a longer moving average from a shorter moving average.
If the MACD is above zero, the market is bullish. If the MACD is below zero, the market is bearish.
Trading Strategies for Bull Markets
In a bull market, the price of assets usually tends to rise, and investors can achieve substantial profits. Here are some strategies to consider when the market is bullish:
Buy and Hold
This involves buying stocks or mutual funds and holding them for the long term, regardless of market volatility. This strategy tends to generate significant gains over time when the selected product shows a sustained growth rate.
Investing in Growth Stocks
During a bull market, growth stocks tend to outperform value stocks. These companies have significant growth potential, which makes them attractive to investors.
Investing in ETFs
Exchange-traded funds are an effective way to invest in a bull market. ETFs diversify exposure to various assets and sectors, which can reduce risk.
Use the Average Costing Strategy
This consists of investing a fixed amount of money in an asset at regular intervals. This helps investors buy more shares when the price is low and less when the price is high.
Trading Strategies for Bear Markets
During a bear market, asset prices often fall, which can make investors uneasy. Here are some strategies to consider in a bear market:
Sell and Wait
Traders can sell their stocks and wait for the market to stabilize again before reinvesting. However, this strategy can be dangerous, as it is difficult to predict when the market will bottom.
Investing in Bonds
Fixed income as a whole is a reasonably safe form of investment that can offer stable and reliable income in a bear market.
Invest in Defensive Stocks
Defensive stocks are considered to be companies that offer products and services that hold up regardless of economic conditions. Examples include food, beverage, pharmaceutical and utility companies.
Investing in Index Mutual Funds
Index mutual funds offer investors the opportunity to participate in a broad benchmark index, which can help reduce the risk factor in a bear market.
Use Hedging Strategies
To protect their investments from a market downturn, investors can use hedging strategies, for example put options or futures contracts.
Keep in mind that there is no foolproof investment strategy and that markets can be unpredictable, so investors should be aware of the risks and consult a financial advisor before making any investment decisions.
Investor Behaviour in Bull and Bear Markets
In the Short Term
If the market is in a bull cycle (bulls), investors may be more confident and optimistic about the economy and the market overall. This may generate an increase in demand for stocks and other assets, which could increase prices. Consequently, investors who hold shares in bullish companies may see an increase in their net worth.
On the other hand, in a bear market, investors may be more cautious and concerned about the economy and the market overall. This can lead to a decrease in demand for stocks and other assets, which depresses prices. Investors who hold shares in declining companies may see a decrease in their net worth.
Investors can also use market behavior as a signal to buy or sell stocks.
In The LongTerm
In the long term, bull markets are often beneficial to investors, as asset values increase over time. For example, if an investor bought stocks in a company that was rising about 10 years ago, those stocks may be worth more today. As a result, the investor would have earned long-term profits.
On the other hand, falling markets (bears) can be detrimental to long-term investors, because the value of assets can fall and sometimes take time to recover. For example, if an investor bought stocks in a company that was down 10 years ago, those stocks would likely still be worth less today. As a result, the investor would likely have lost money in the long run.
Conclusion
It is important to keep in mind that while the behavior of bulls and bears can affect investors, it is not the only thing that can affect market performance along with individual assets. Other factors, such as the world economy, politics, interest rates, and, of course, inflation, can also significantly affect the financial market and asset performance.